Additional Information
| Author(s) | Kllogjeri , Adrian, Kllogjeri , Pellumb |
|---|


In data analysis are used graphs, tables, and numerical summaries to study the variation present in data under study. Graphs are effective visual tools because they present information quickly and easily. Graphs are commonly used by print and electronic media and, data can be better understood when presented by a graph than by a table because the graph can reveal a trend or comparison. Graphs display the relationship between variables or show the value spread of a given variable or phenomenon. Measuring the central tendency we identify the most representative value in a set of data. Mean, median and mode give different perspectives of a data set's centre, but a data description is not complete until the spread variability is also known. The basic numerical description of a data set requires measures of both centre and spread. In this paper we will be concentrated on graphical representation of data collected from a population. A useful tool to get such nice visual representations is GeoGebra. GeoGebra is an interactive geometry system and, by the use of its virtual tools, we can do constructions with points, vectors, segments, lines; we can construct histogram and geometrically show the positions of the median and quartiles [4]. GeoGebra provides numerical calculations for the measures of data centre and spread. GeoGebra software is very useful and helpful for teachers and students to graphically present data and easy understand and interpret them [6]. Also, GeoGebra is dynamic mathematics software for schools that joins geometry, algebra, and calculus. Using this dynamic feature in the teaching hour of statistics, the students have a better and fuller understanding about data measures and data spread.
| Author(s) | Kllogjeri , Adrian, Kllogjeri , Pellumb |
|---|
 An Inertial Method for Approximating Solutions of Split Equality Problems for Generalized Mixed Equilibrium and Fixed Points of Multi-Valued Mappings in Banach Spaces
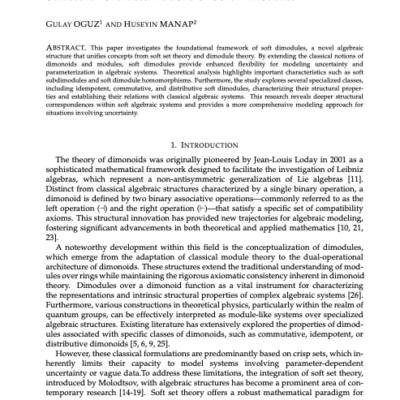 Structural Characterizations of Soft Dimodules
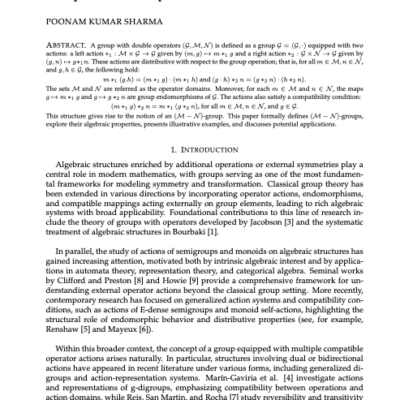 Group with double operators
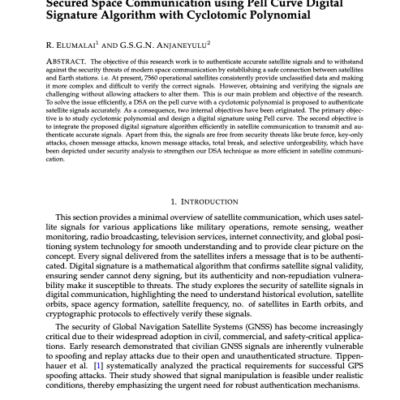 Secured Space Communication using Pell Curve Digital Signature Algorithm with Cyclotomic Polynomial
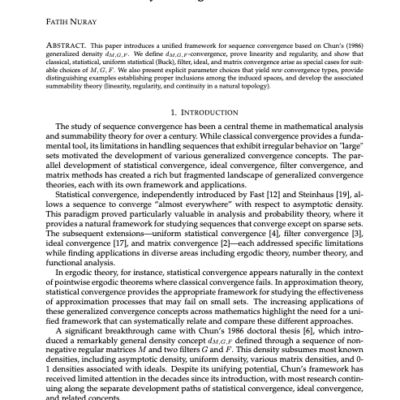 Generalized Density Convergence
 Some New Results on GK-algebras. A Different Approach to the Internal Architecture of GK-algebras
 Positive solutions to higher order fractional boundary value problems with non-homogeneous conditions
 Further Study on the s-Shunt Intersection Graph of a Graph
 Existence, Uniqueness and Stability Analysis of Solutions for a ψ-Caputo Fractional Spatial Heterogeneous Viral Infection Model
 Automorphisms and Structural Properties of Cayley Graphs on Matrix Monoids